June 6, 2026
How a Fair Coin Spends Most of Its Life Looking Unfair?

Here is a question that sounds simple and isn't. Suppose two friends, Alice and Bob, play a game. A fair coin is tossed once per second. Heads, Alice scores a point; tails, Bob does. They keep playing for a whole year — more than thirty million tosses. At every moment, one of them is "in the lead" (has more points so far). What is more likely?
- A) The lead changes hands often, so each player leads for roughly half the year.
- B) One player grabs the lead early and keeps it for almost the entire year, while the other spends month after month behind.
Almost everyone picks (A). It feels obvious: the coin is fair, so the lead should be shared fairly. Yet the surprising truth — proven in the middle of the twentieth century — is that (B) is far more likely than (A). A perfectly fair coin spends most of its life looking deeply unfair.
This article is about that paradox, and about the beautiful chain of ideas needed to explain it: random walks, the bell curve, Brownian motion, and a strange U-shaped curve called the arcsine law.
A walk built from coin tosses
Let's turn the game into a picture. Start a running total at zero. Every heads adds ; every tails subtracts .
Toss:     H   T   H   H   T   T   T   H
Step:    +1  -1  +1  +1  -1  -1  -1  +1
Total:    1   0   1   2   1   0  -1   0
If the total is positive, Alice is ahead; if negative, Bob is. Plot the total against time and you get a jagged path that wanders up and down. Mathematicians call this a random walk.
 +3 |
 +2 |        ___
 +1 |    ___/   \___        ___
  0 |___/           \___   /
 -1 |                   \_/
    +------------------------- time
A random walk is the simplest example of a stochastic process — a fancy term for a system that changes step by step, with a dash of randomness at every step. You already know many of them. The price of a stock is a stochastic process: every tick it nudges up or down, and nobody can say which. The position of a tiny pollen grain jiggling in water is one too. So is the path of a person who has had a little too much to drink, deciding at each step whether to lurch left or right — the classic "drunkard's walk."
Now here is the single most important idea in the whole article, so hold onto it:
There is a difference between the destination and the journey. Where the walk ends up is one question. What the walk does along the way is a completely different question.
Keep both of those in mind. The paradox lives in the gap between them.
The bell curve appears
Let's start with the destination. After a million tosses, roughly where is the total?
Each toss is equally likely to be or , so on average the total stays near zero. But "on average" hides a lot of wandering. If you ran thousands of these million-toss games and made a histogram of the final totals, a familiar shape would emerge:
            .:||:.
          .:||||||:.
        .:||||||||||:.
      .:||||||||||||||:.
   ..:||||||||||||||||||:..
 -----------------0----------------
        final total after n tosses
This bell shape is the famous Central Limit Theorem (CLT) in action: add up a large number of small independent random nudges, and the total follows a bell curve (a "normal distribution"), no matter what the individual nudges looked like.
But notice what the CLT actually told us — and what it did not:
The Central Limit Theorem tells us where most walkers end up. It says nothing about how they got there.
That is the loophole the paradox sneaks through.
Zooming out: from random walks to Brownian motion
Before we return to the puzzle, let's zoom out — literally.
Take a random walk and shrink it. Make the steps smaller and more frequent: instead of one big step per second, take a hundred tiny steps, then ten thousand even tinier ones. As the steps shrink toward nothing, the jagged staircase smooths into a continuous, infinitely wiggly curve.
   coarse walk        finer walk          finest → Brownian motion
   _                  _                    .·'·.
  | |_      _        | |_   _.            ·    '·._.·'·.
  |   |_   | |       |   '·' |.            ·             '·.
 _|     |__| |     _·'         '·_       ·'                  '·.
That limit has a name: Brownian motion, after the botanist Robert Brown, who in 1827 watched pollen grains tremble endlessly in water without knowing why. Einstein explained the trembling in 1905 (the grains are kicked around by invisible water molecules), and the mathematician Norbert Wiener built the exact mathematical model in the 1920s. The deep fact that a shrinking random walk becomes Brownian motion is known, informally, as Donsker's theorem. We will only mention it for now.
Brownian motion is what a random walk looks like when you zoom out forever.
But why should specks floating in water have anything to do with a coin-flip game? Because the speck is playing one. A grain of pollen is far too big to move on its own — until the invisible water molecules around it, jittering with heat, hammer into it from every direction at once. At each instant a few more happen to strike from the left than from the right, and the grain lurches slightly to the right; a moment later the imbalance reverses and it lurches back. Every collision is a tiny random nudge — a coin toss repeated millions of times a second. Follow the grain's position over time and it traces the very same jagged, wandering path we drew for Alice and Bob. The abstract coin-flip walk and the trembling fleck of pollen are not merely alike; they are the same mathematical object — and that object is Brownian motion.
Have you ever flipped a few coins on our /play page, watched one side surge ahead and stay ahead, and wondered whether the randomness might be broken?
Let's go back to the water. A single drop of river water has the answer.
Picture a molecule of water drifting down a wide, slow river. Ignore the downstream current for a moment and watch only how it wanders across the river, from one bank toward the other. Each collision shoves it a little to the left or a little to the right — a coin-flip walk all over again — so if you plot that side-to-side position as the molecule floats downstream (with distance travelled downstream standing in for time), you are drawing our graph yet again. Now: would you ever expect the molecule to glide politely down the exact middle of the river for its whole journey? Of course not. It drifts to one bank and lingers there for a long stretch, wanders across, hugs the other bank for a while. Staying balanced in the center is the one thing it almost never does.
 +3 |               __
 +2 |        ___   /  \
 +1 |    ___/   \_/
  0 |___/
 -1 |
    +------------------- time
A fair coin behaves the same way. When you flip coins on /play and see one side win eight times in a row, or watch "heads" stay in the lead for a hundred flips straight, it can feel like the coin is broken or the app is rigged. It isn't. Long stretches of one-sided dominance are not a glitch in fairness — they are exactly what fairness looks like up close. The molecule does not stay mid-river, and the coin does not stay near a tie.
If you want to know more about how we flip the coin in FlipTheCoin.app, you can read How we toss a coin in FlipTheCoin.app.
Lévy's discovery and the Chung–Feller surprise
Now back to Alice and Bob. We want to measure the journey, not the destination. So we ask:
Out of the whole year, what fraction of the time was Alice in the lead?
Call that fraction , a number between (Alice was never ahead) and (Alice was ahead the entire time). Since we just learned about the bell curve, your instinct probably says: this fraction should pile up around , with a nice hump in the middle. Half the time for Alice, half for Bob — fair is fair.
That instinct is wrong. The real distribution looks like this:
 likely  |\                            /|
         | \                          / |
         |  \                        /  |
         |   \__                  __/   |
 rare    |      \________________/      |
         +------------------------------+
         0     1/4     1/2    3/4       1
           Fraction of time Alice leads
It is a U-shape. The most likely outcomes are the extremes — Alice leading almost all the time, or almost none of the time. The least likely outcome is the "fair" one, where the lead is split evenly. The fraction of time in the lead behaves in the exact opposite way to the final score.
This was pieced together by several mathematicians:
- In the late 1930s, Paul Lévy — one of the founders of modern probability — studied how long a Brownian motion spends on the positive side. He found this strange U-shaped law for the continuous case.
- William Feller, in his legendary textbook An Introduction to Probability Theory and its Applications, worked out the discrete coin-tossing version in clean, countable detail.
- And the Chung–Feller theorem (Kai Lai Chung and William Feller, 1949) nailed down a precise combinatorial fact underneath it all: among all the ways a walk of a given length can return to zero, the number of them spending a given amount of time positive is astonishingly constant — the lead duration is, in a deep sense, spread out rather than concentrated.
Here's a metaphor to make the U-shape feel real. Two marathon runners cross the finish line in a dead tie. You might assume they must have traded the lead back and forth the whole race. But it is far more common for one runner to surge ahead in the first mile and lead for almost the entire course, only to be caught right at the tape. A tied finish does not mean a shared race.
The arcsine laws
The U-shaped curve has a name and a formula. It is called the arcsine distribution, and on the interval from to its density is:
You can read the U-shape straight off the formula: as approaches or , the bottom of the fraction shrinks toward zero, so the curve shoots up. The middle, around , is where it sags lowest.
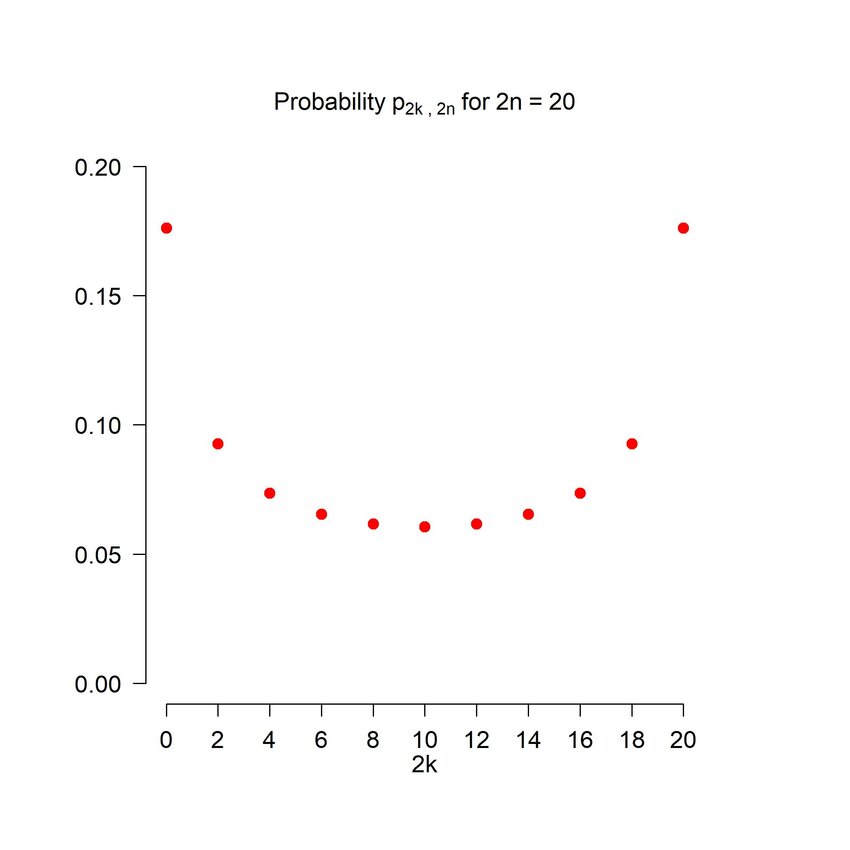
For the actual coins, before any zooming out, the discrete version is just as clean. If a fair coin is tossed times, the probability that the walk spends exactly of those steps on the positive side is:
Here and are just counters — plain whole numbers. We deliberately write the number of tosses as an even number and the time spent in the lead as an even number , because in this kind of walk the score can only return to a tie after an even number of tosses, and the time one player spends ahead always works out to be even as well. The counter ranges from (never in the lead) up to (in the lead the whole game), so the fraction of time ahead is simply .
Let's check it for a tiny game of just tosses, so and . Now can only be , , or , so the fraction of time in the lead is , , or . The three probabilities come out as for "never ahead", for "ahead exactly half the time", and for "ahead the whole game". Even in this baby example the U is already there: the two extremes are each more likely than the fair-looking middle. Make the game longer and the U only deepens.
Here is the part that always makes us smile — quite literally. Plot these probabilities for a small game and you get just a handful of points tracing the U. Because the values at the two ends tower over the sagging middle, those end points sit like a pair of wide eyes above a low, curved mouth: the arcsine distribution appears to be grinning back at you. It is a fitting little joke — the curve whose whole message is that a fair coin will almost always look unfair wears a face that seems rather pleased about it.
The truly magical part is that the same arcsine law shows up for three different questions about the very same walk:
- First arcsine law — the fraction of time spent in the lead (above zero). Extremes win.
- Second arcsine law — the moment the walk hits its maximum. The peak is most likely to happen near the very start or the very end, and least likely in the middle.
- Third arcsine law — the last time the walk touches zero (the final tie). Again: an early or a late final tie is far more likely than one halfway through.
Three different questions, one weird curve. That repetition is what makes the arcsine laws feel like a piece of hidden machinery in randomness itself.
One delightful footnote on the name. We have met the word "arcsine" on this blog before, in the article about flipping a coin until you reach π. That piece is about the arcsine function from trigonometry; this one is about the arcsine distribution. They are different objects — but not strangers. The distribution earns its name because the chance of leading less than a fraction of the time is exactly , the arcsine function in disguise. And both stories are secretly powered by the same number, the central binomial coefficient . Randomness keeps reusing its favorite parts.
What the Central Limit Theorem doesn't tell us
At this point a careful reader feels a contradiction coming. We said the final score follows a tidy bell curve centered at a tie. Now we're saying the lead is almost never evenly shared. Is the Central Limit Theorem wrong?
No. The two laws are answering two completely different questions about the same coin. This is the journey-versus-destination split from the very beginning, made precise:
| What we measure | Which law governs it |
|---|---|
| Final score (where the walk ends) | Central Limit Theorem — bell curve |
| Fraction of time in the lead | Arcsine law — U-shape |
| Time the maximum lead occurs | Arcsine law — U-shape |
| Moment of the last tie | Arcsine law — U-shape |
Same process. Different observables. Different answers. The coin can finish almost level (the bell curve, about the destination) and spend nearly the whole game lopsided (the arcsine law, about the journey). There is no contradiction — only two truths that live in the gap we marked out at the start.
A final reflection on randomness
Why does the U-shape feel so wrong to us? Because we are storytellers. We don't experience a year, or a game, or a life, as a single final score. We live it moment by moment, as a path. And a path that lingers on one side for ages reads to us like momentum, like a streak, like a hot hand, like destiny — even when it is nothing but a fair coin doing exactly what fair coins do.
Our gut is unreliable at both ends of the spectrum. We badly underestimate how long an ordinary fair coin will stay one-sided — and we just as badly overestimate the truly spectacular streaks. As Evelyn Lamb explains in a lovely piece on whether anyone has ever flipped 76 heads in a row, runs that feel like they should turn up every now and then are so astronomically unlikely that, across all the coins ever flipped, they essentially never have.
The Central Limit Theorem promises that randomness balances out in the long run. The arcsine laws add a quieter, stranger warning: that balancing can stay completely invisible while it is happening. The books only even out when you step far enough back to see the whole thing at once.
So the next time a fair process looks unfair — a coin on a streak, a bad season where nothing goes your way — remember the molecule in the river. It is not broken. It is not rigged. It simply never promised to stay in the middle. Life comes in waves and as Einstein said, "Life is like a bicycle; to keep your balance you must keep moving".
Put theory into practice: flip a coin online and watch a fair coin look unfair and how streaks of repeated results are much more likely than you might expect.